Multiple Choice
Identify the
choice that best completes the statement or answers the question.
|
|
|
1.
|
Which set of points represents a function?
|
|
|
2.
|
Which is the rule for the function table? 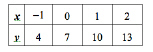
|
|
|
3.
|
Which graph shows a function?
|
|
|
4.
|
Patrick pays $10 per month for recycling. He expects the cost to increase
70¢ every 2 years. What is the slope that represents his cost change per year?
|
|
|
5.
|
Which equation gives the direct variation if  when  ?
|
|
|
6.
|
Which set of ordered pairs represents a function?
a. | (2, 1), (3, 1), (5, 1), (5, 4) | c. | (2, 5), (1, 6), (0, 5), (1,
10) | b. | (5, 4), (4, 5), (1, 2), (1, 4) | d. | (0, 0), (1, 1), (2, 0), (3,
3) |
|
|
|
7.
|
Write a rule for the linear function.  a. | f(x) =  x – 3 x – 3 | c. | f(x) =  x2 + 3 x2 + 3 | b. | f(x) =  x +
3 x +
3 | d. | f(x) =  x – 3 x – 3 |
|
|
|
8.
|
Which graph represents a function?
|
|
|
9.
|
Determine if the relation represents a function. 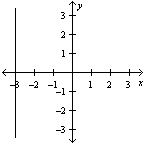 a. | The relation is a function. | b. | The relation is not a
function. |
|
|
|
10.
|
Which is a solution to the equation  ?
|
|
|
11.
|
Determine if the relation represents a function. a. | The relation is a function. | b. | The relation is not a
function. |
|
|
|
12.
|
What is the equation of the line that passes through the points  and  ?
|
|
|
13.
|
Choose the equation that is represented by the data in the table. 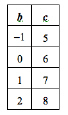
|