Multiple Choice
Identify the
choice that best completes the statement or answers the question.
|
|
|
1.
|
Graph the equation  and tell whether it is linear. a. | 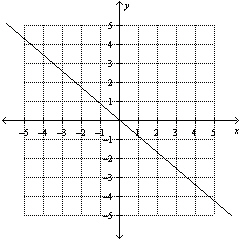
linear | c. | 
linear | b. | 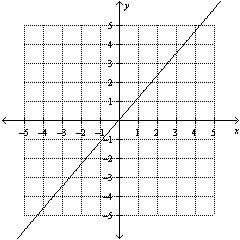
linear | d. | 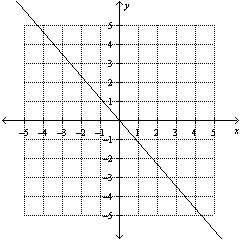
linear |
|
|
|
2.
|
The cost C, in dollars, for advertising on a social networking website is
proportional to the number n of clicks on the advertisement. Suppose a business is charged $45
for 180 clicks on its advertisements. What is the slope of the line that represents the relationship
between cost and clicks?
a. | 4 | b. | 1 | c. | 0.25 | d. | The slope cannot be
determined. |
|
|
|
3.
|
Determine whether the data sets show a direct variation. Number of People | Time
(min) | 10 | 4 | 14 | 5.6 | 17 | 6.8 | 19 | 7.6 | 20 | 8 | | |
|
|
|
4.
|
The graph shows the distance Julie walks over time. Does she walk at a constant
or variable speed? How fast is Julie walking? 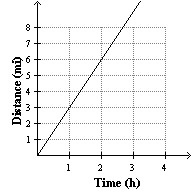 a. | constant speed; 1.5 mi/h | c. | constant speed; 3
mi/h | b. | constant speed; 6 mi/h | d. | variable speed; 6 mi/h |
|
|
|
5.
|
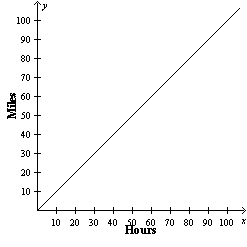
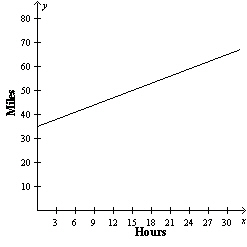
The linear equation  describes how far from home Deena is as she drives from
Montreal to Miami. Let x represent the number of hours and y represent the number of
miles. How far from home is Deena in 12 hours? Graph the equation and tell whether it is linear.
a. | Deena is about 35 miles from home in 12 hours.
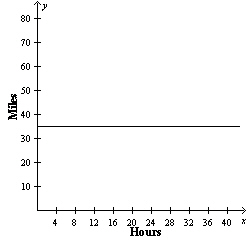 linear linear | b. | Deena is about 12
miles from home in 12 hours.
 linear linear | c. | Deena is about 420 miles from home in 12
hours.
 linear linear | d. | Deena is about 47 miles from home in 12
hours.
 linear linear |
|
|
|
6.
|
The graph shows a proportional relationship. Use the graph to identify the unit
rate. 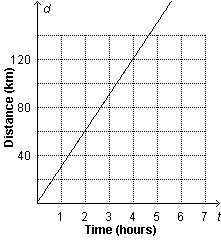
a. | 30 hours per kilometer | b. | 60 kilometers per hour | c. | 30 kilometers per
hour | d. |  kilometers per hour kilometers per hour |
|
|
|
7.
|
Determine whether the data sets show a direct variation. Length (in) | Number of Books | 11 | 22 | 15 | 30 | 17 | 34 | 18 | 36 | 20 | 40 | | |
|
|
|
8.
|
The number of pages p that a laser printer prints is proportional to the
printing time t, in minutes. Printer A prints 104 pages in 4 minutes. The table shows the
relationship between the amount of time and the number of pages printed for printer B. Which printer
prints more slowly? Time
(minutes) | Pages
printed | 3 | 84 | 5 | 140 | 9 | 252 | 14 | 392 | | |
a. | Printer A | b. | Printer B | c. | Printer A and
printer B have the same unit rate. | d. | The relationship cannot be
determined. |
|
|
|
9.
|
Determine whether the data sets show a direct variation. Number of Baskets | Cost | 3 | $10 | 5 | $18 | 7 | $21 | 9 | $27 | 10 | $30 | | |
|
|
|
10.
|
Given that y varies directly with x, find the equation of direct
variation when  and  . a. | y =  x x | c. | xy =  | b. | y =  x x | d. | xy =  |
|
|
|
11.
|
The graph shows the distance a boat is traveling over time. Does the boat travel
at a constant or variable speed? How fast is the boat traveling? 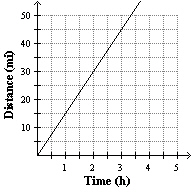 a. | constant speed; 7.5 mi/h | c. | variable speed; 30
mi/h | b. | constant speed; 30 mi/h | d. | constant speed; 15 mi/h |
|