Multiple Choice
Identify the
choice that best completes the statement or answers the question.
|
|
|
1.
|
The graph shows the relationship between the number of hours h Greg has
been driving and the total distance d he has traveled, in miles.  Which
statement is true? a. | To find Greg’s rate of speed, multiply the total number of hours driven by the
total distance. | b. | Greg is traveling at 75 miles per hour. | c. | To find Greg’s
rate of speed, divide the total number of hours driven by the total distance. | d. | Greg is traveling at
25 miles per hour. |
|
|
|
2.
|
The graph shows the relationship between the number of hours h Bree has
been hiking and the total distance d she has traveled, in kilometers. 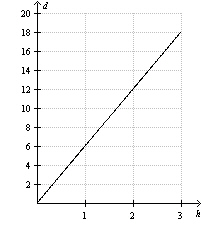 Which
statement is true? a. | The slope of the line is 18. | b. | To find the slope of the line, you could divide
the total distance by the total hours hiked. | c. | The slope of the line is
12. | d. | To find the slope of the line, you could multiply the total number of hours hiked by
the total distance. |
|
|
|
3.
|
The graph shows a proportional relationship. Use the graph to identify the unit
rate. 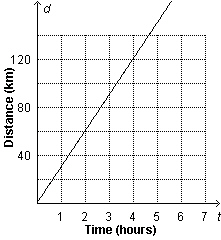
a. | 30 hours per kilometer | b. | 60 kilometers per hour | c. | 30 kilometers per
hour | d. |  kilometers per hour kilometers per hour |
|
|
|
4.
|
The graph shows the distance Renee walks over time. Does she walk at a constant
or variable speed? How fast is Renee walking?  a. | constant speed; 9 mi/h | c. | constant speed; 2.25 mi/h | b. | variable speed; 9
mi/h | d. | constant speed; 4.5
mi/h |
|
Numeric Response
|
|
|
5.
|
 a = 10 b = 20 c = 20 d
= 40 e = 30 f = 60 g = 50 h = 100 Find the rate of change for
the above table. (put your answer in as a fraction or integer)
|
|
|
6.
|
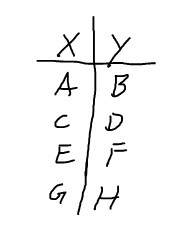 a = 7 b = 42 c = 14 d =
84 e = 21 f = 126 g = 35 h = 210 Find the rate of change for the
above table. (put your answer in as a fraction or integer)
|
|
|
7.
|
(4,16), (12,48), (8,32)
Use the above ordered pairs to find
the rate
of change (put answer in as
a fraction or integer)
|
|
|
8.
|
(8,64), (24,192), (16,128)
Use the above ordered pairs to find
the
rate of change (put answer in as
a fraction or integer)
|
|
|
9.
|
 a = 10 b =7 Find the
rate of change for the above line. (put your answer in as improper fraction or integer)
|
|
|
10.
|
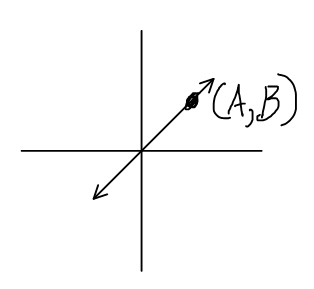 a = 9 b =12 Find the
rate of change for the above line. (put your answer in as improper fraction or integer)
|
|
|
11.
|
 a = 5 b =4 Find the
rate of change for the above line. (put your answer in as improper fraction or integer)
|